LabHQ Q1 2026 Release: Real-Time Dashboard, Full Rebrand and More
A Modern New Look for LabHQ
The LabHQ main app has had a full modern rebrand, bringing the main app in line with the external user portal and product website for a consistent user experience end to end.
The result is a cleaner, more intuitive interface that reflects where LabHQ is heading - modern lab management software built for the way labs actually work today.
Real-Time Laboratory Dashboard: Your Whole Lab, One Screen
The centrepiece of Q1 is a new intuitive dashboard - a real-time overview of lab operations that every user sees immediately on login.
The dashboard refreshes automatically, keeping data current throughout the day. Some widgets are also interactive - click through directly to the relevant area of LabHQ to investigate or take action. Spot low stock? Click it. See overdue samples building up? Click through to investigate. It's your whole lab on one screen, fully actionable.
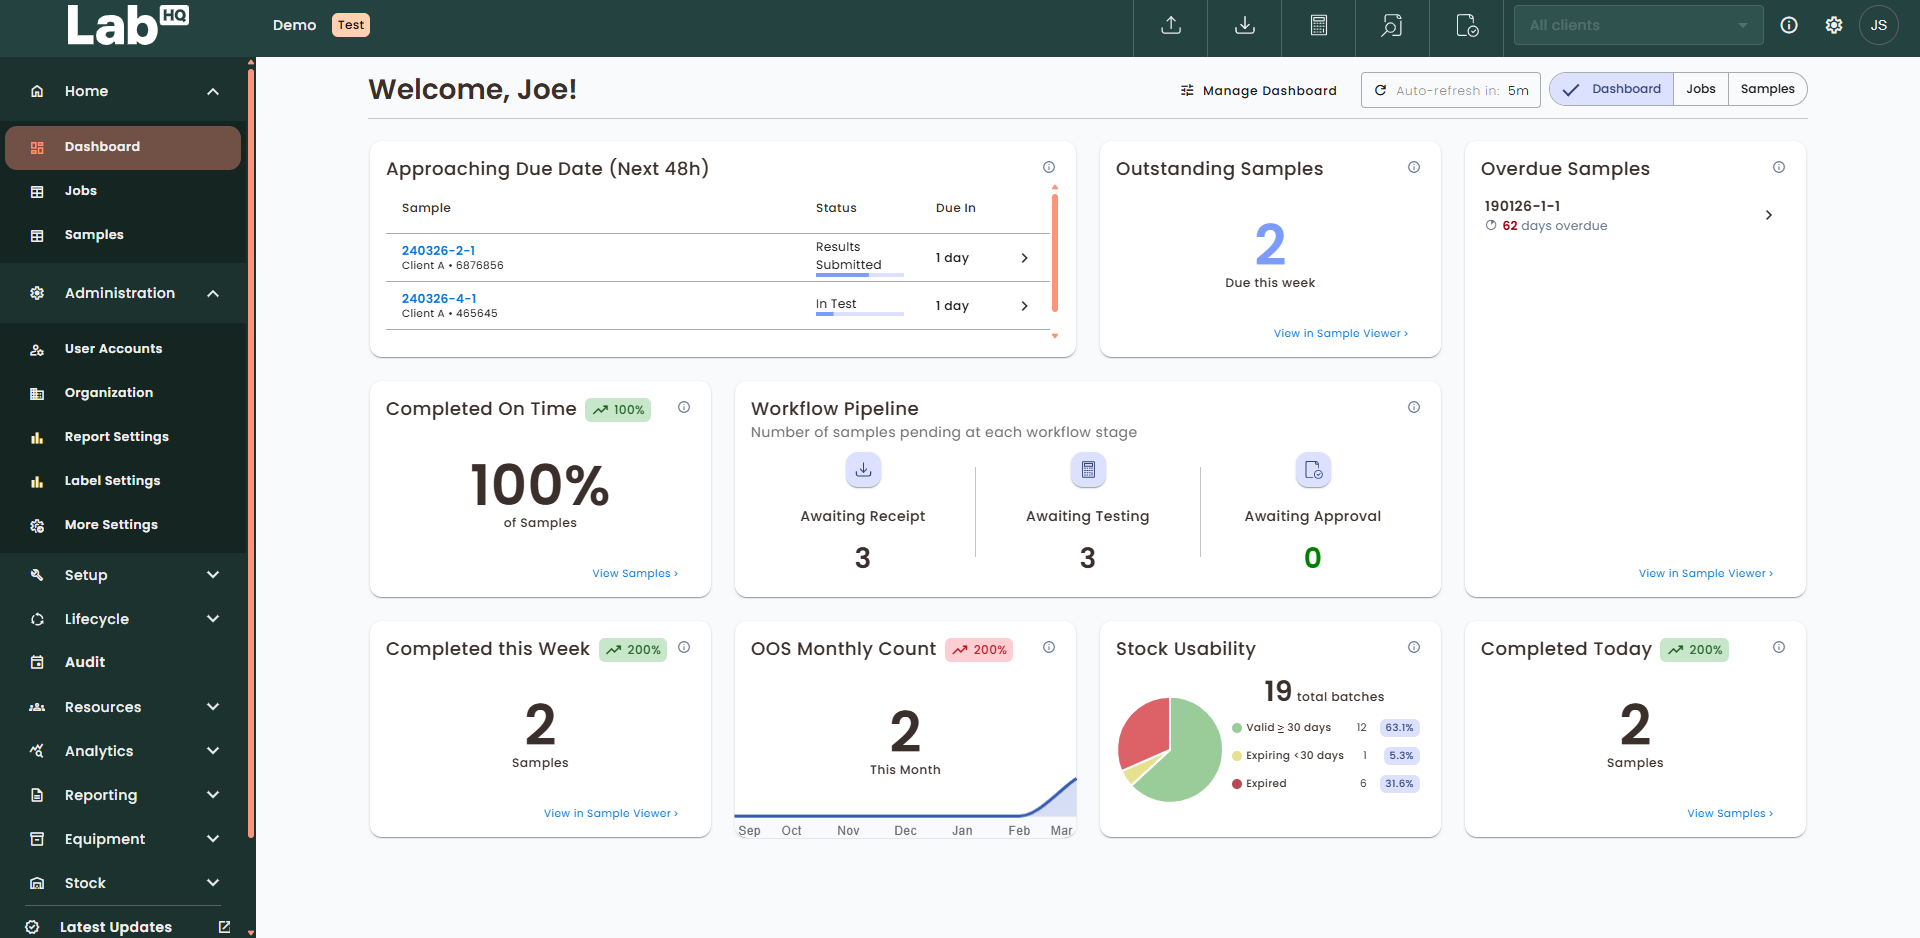
Sample Tracking & Throughput Widgets
- Samples completed today - with a comparison to the same day last week
- Samples completed this week - with a week-on-week trend
- On-time rate for the current month versus last month
- Outstanding samples due by end of the current week
- Samples approaching due date - flagging anything due within the next two days
- Workflow pipeline - a visual breakdown of how many samples sit at each stage, making bottlenecks immediately visible
- Overdue samples - surfacing the most critical overdue items, ordered by days overdue
Quality & Investigation Widgets
- OOS monthly count - out-of-specification results for the current month with a 6-month trend
- Active investigations by age - so nothing sits unresolved without visibility
- Investigation volume -current workload plus a 12-month historical trend
- Time to investigation closure - median closure time over a rolling 6-month period
Stock Management Widgets
- Stock levels - a high-level inventory overview with a visual health bar showing the proportion of items above minimum threshold
- Stock near expiry - highlighting batches expiring within 48 hours
- Expired stock - a category-level breakdown of expired batches requiring review or disposal
- Stock usability - a clear split of usable versus expired/ expiring stock across all batches
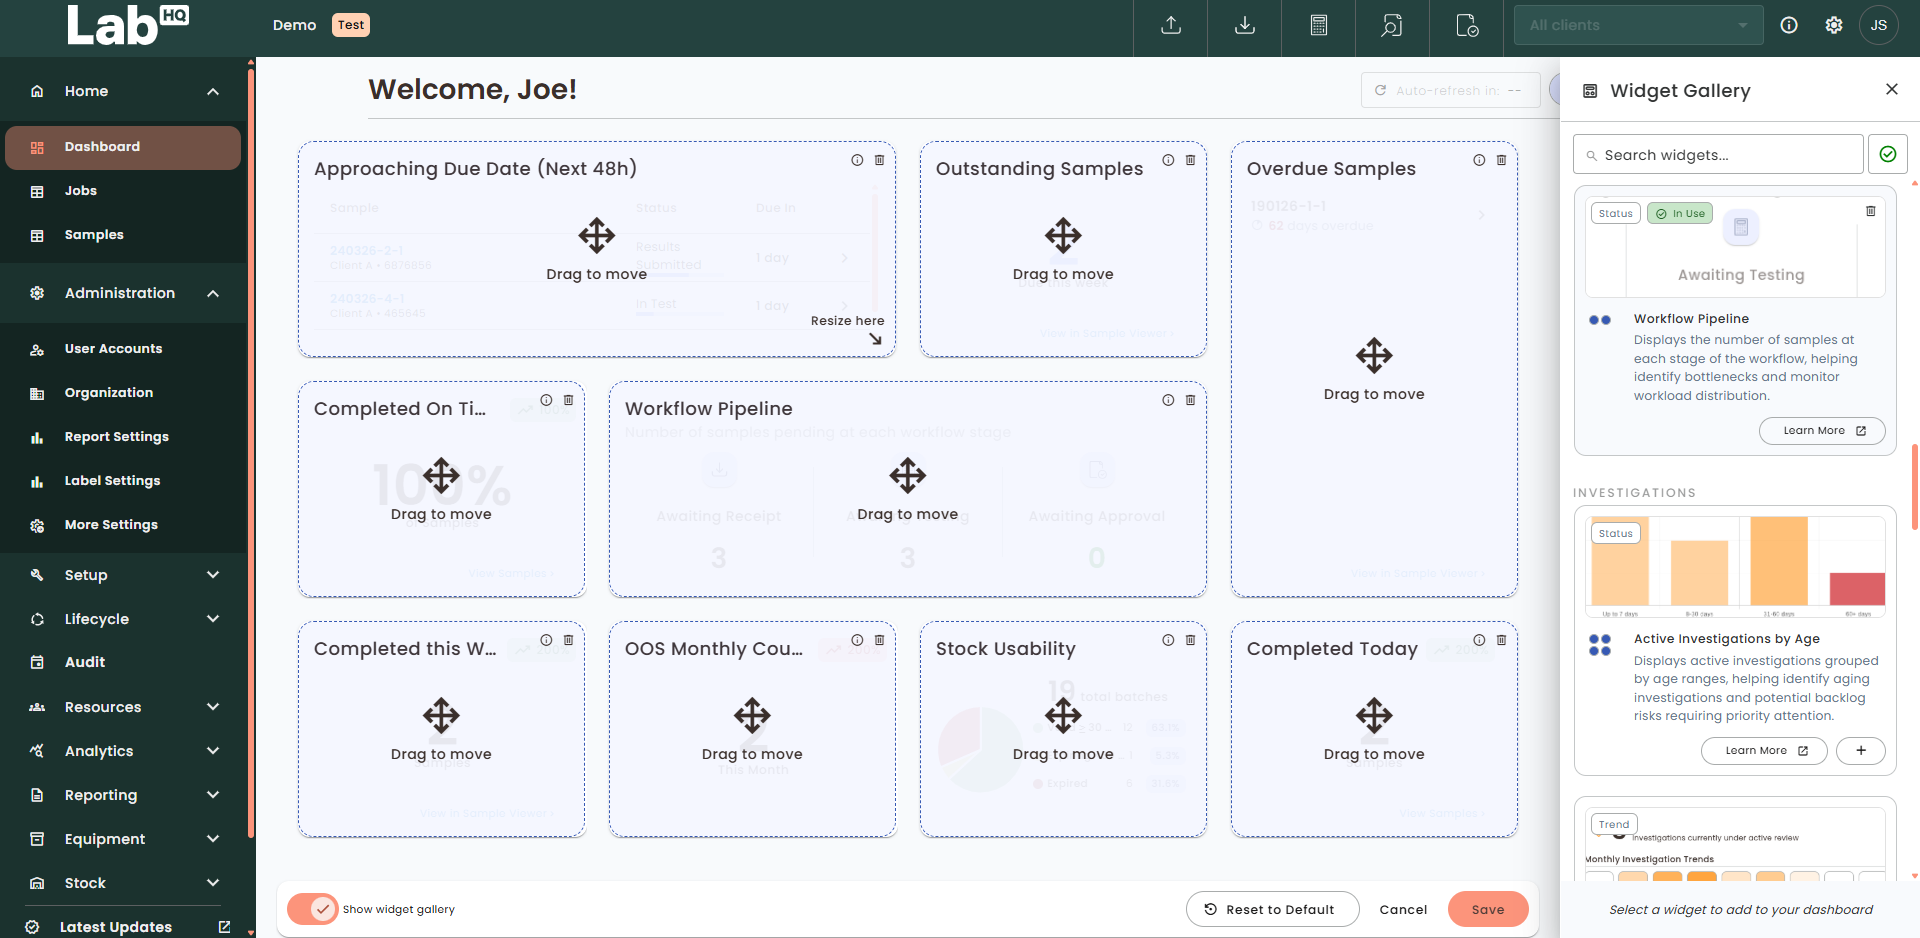
Customize Your Dashboard to Suit Your Lab
On paid tiers, users can fully personalize their dashboard by adding, removing, resizing, and rearranging widgets. A widget gallery makes it easy to browse what's available, filtered by subscription tier and current dashboard setup.
Layout preferences are saved per user - so a lab manager focused on throughput and a QA lead focused on investigations each log in to exactly the view they need.
Smarter Onboarding for New Users
Getting new team members up and running in a LIMS is often a friction point. Three new features in LabHQ make it significantly smoother:
- Welcome widget - greets first-time users with an introduction to LabHQ and an orientation video
- Support widget - puts help resources and contact details front and centre from day one
- Onboarding checklist - guides users through essential setup tasks (organization info, users, products, test methods) with progress tracking and direct links to each area
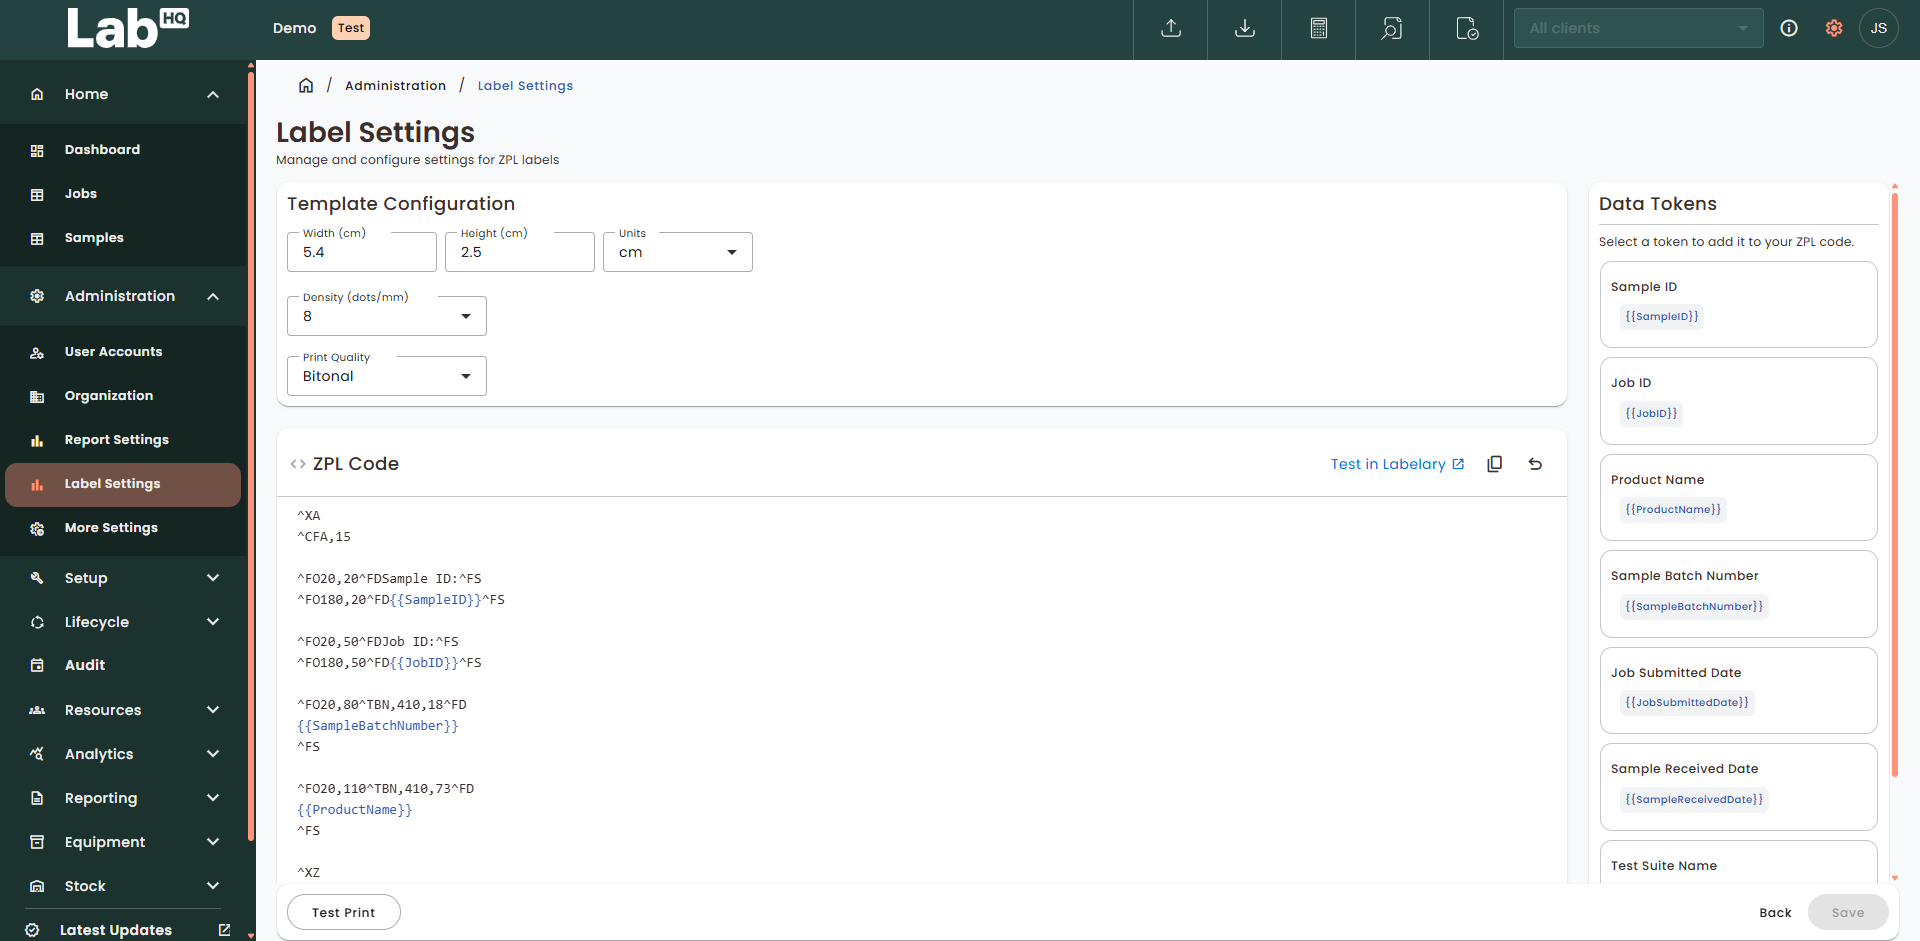
Customizable Sample Labels
Labs can now build fully custom sample label templates using ZPL (Zebra Programming Language), with control over dimensions, layout and the data displayed. Dynamic tokens populate labels automatically with the correct sample data - reducing manual input and the errors that come with it.
Workbook Improvements
Analysts can now record results in workbooks grouped by test method, then by input and then by sample - matching the natural order in which lab testing is performed. This reduces the need to jump between sections and makes data entry faster and less error-prone.
Other Updates in Q1
- Data previews in the sample lifecycle - view key details for products, test methods, jobs, samples and clients without leaving your current screen
- Stock corrections - users can now record both stock increases and reductions during reconciliation, ensuring inventory levels accurately reflect what's on the shelf
- Expired stock email notifications - automated daily alerts for expired stock batches not yet disposed of, with a prioritised summary and a direct link into LabHQ
What This Means for Your Lab
The Q4 2025 release built a solid foundation for stock management. Q1 2026 takes a bigger step - bringing real-time visibility, a more intuitive interface and a smarter onboarding experience to every user.
For lab managers tracking throughput, turnaround times, stock health and quality performance, having all of that data on one screen, without running a report or navigating multiple areas, is a meaningful change to how a working day starts.
See the Q1 Update in Action
The update goes live 31st March 2026 and deploys automatically for all existing LabHQ customers. Just log in and you'll see the new dashboard straight away.
New to LabHQ? There's never been a better time to take a look.